An interactive astronomy presentation
Weighing a galaxy Can the stars we see explain
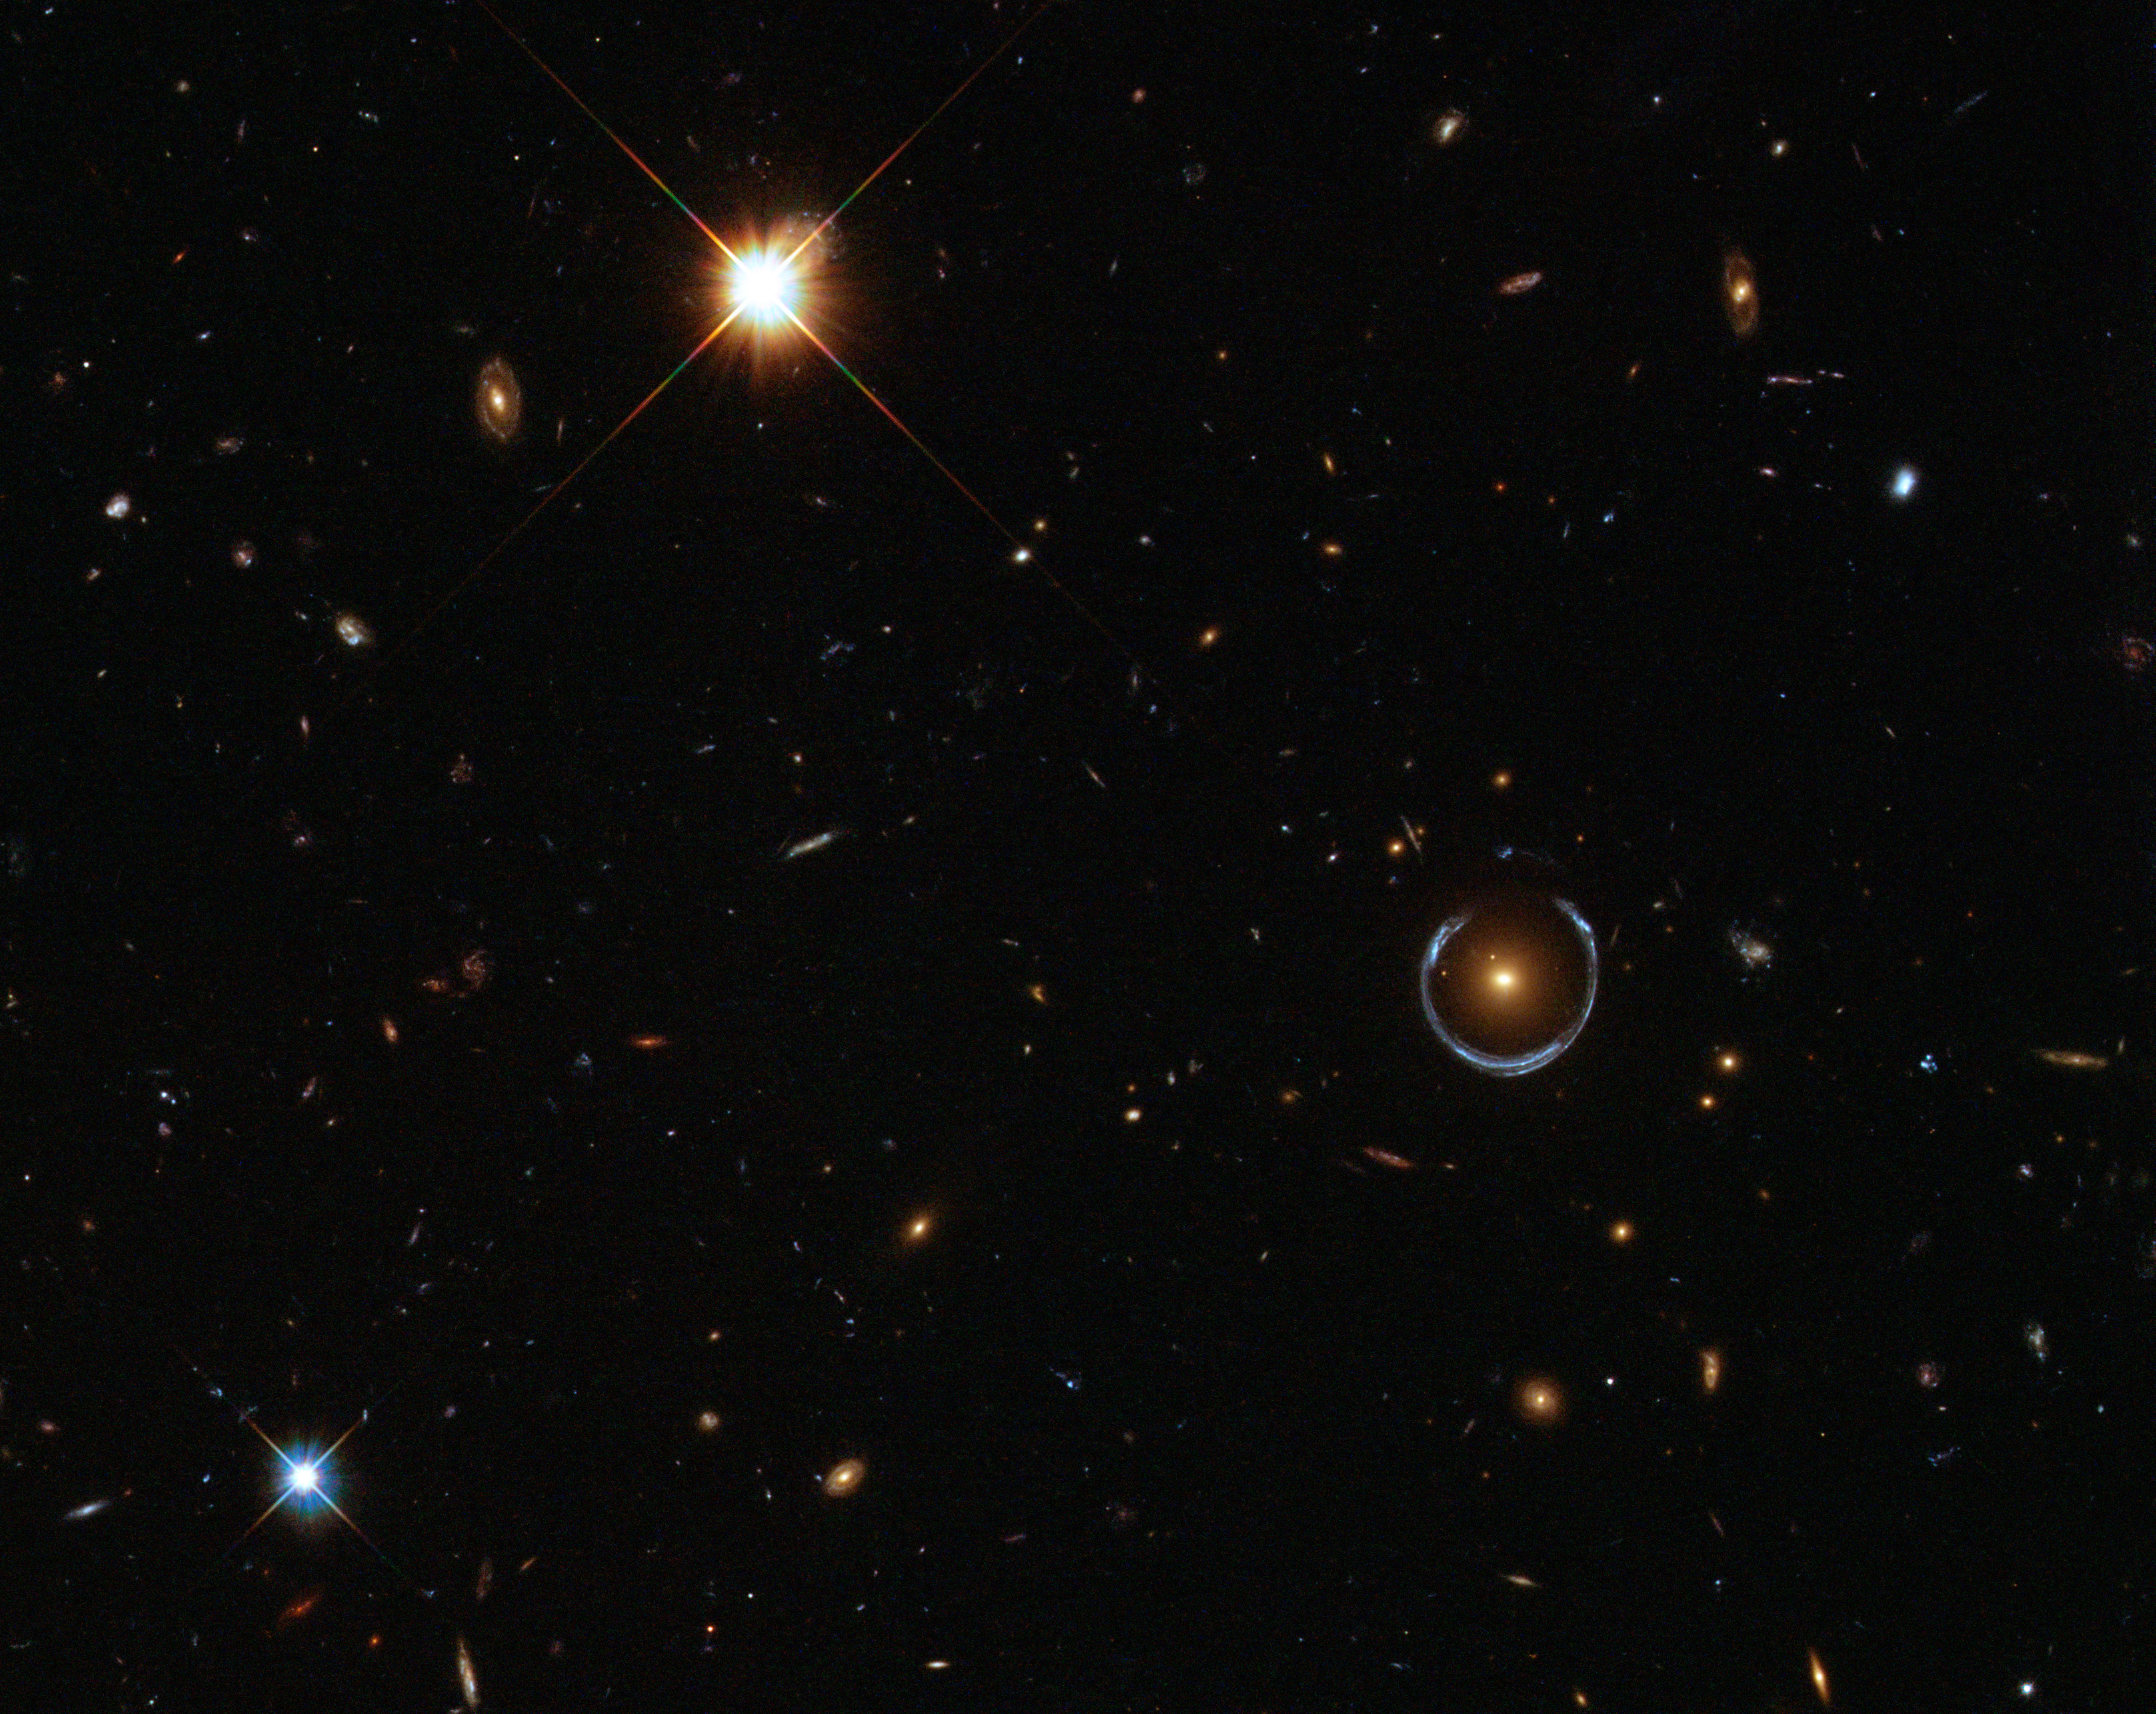
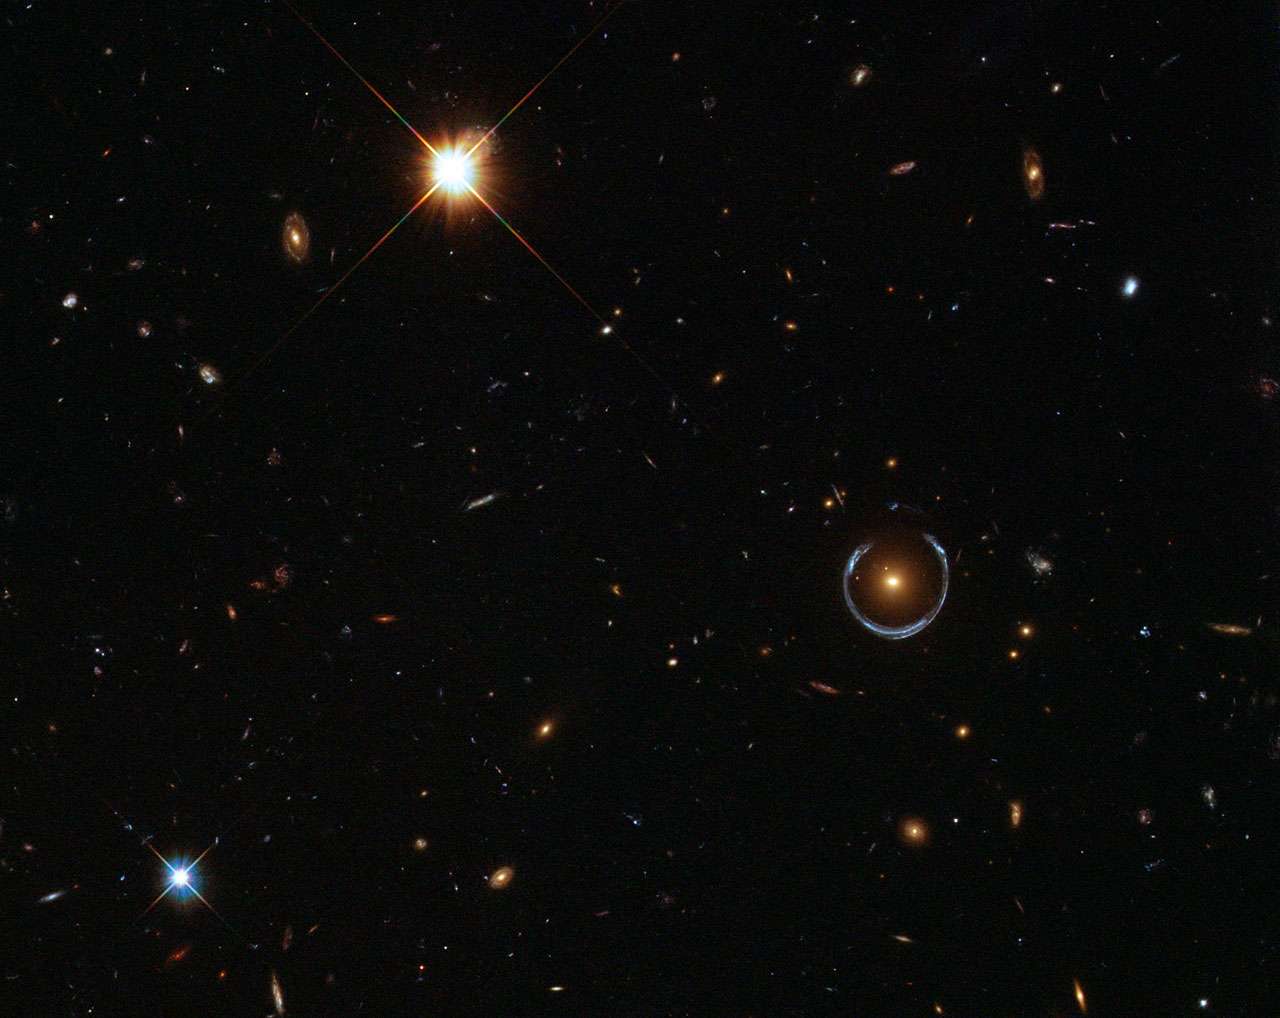
What am I looking at? The gold center is the lens galaxy. The blue horseshoe is a more distant galaxy whose light bends around it.
Cosmic Horseshoe Hubble observation · ESA/Hubble & NASA First, we need to understand why light bends at all.
02 / The mechanism
More mass bends a ray more The foreground galaxy pulls a passing light ray toward it.
lens galaxy incoming light b Illustrative path; bending angles exaggerated.
Now repeat that bend for light passing on every side of the galaxy.
03 / The geometry
Many bent paths form one ring The same bend happens on every side. The paths that reach us trace a circle.
Real Hubble image. Gold: your simulated ring.ESA/Hubble & NASA Gold paths Light that lands on Earth.
Blue paths Light that misses us.
Drag the scene to rotate. Slide to zero mass to straighten the rays.
Illustrative geometry. Bending exaggerated. A larger lens mass makes a larger ring.
The ring has a size we can measure. How does that size depend on mass?
04 / The relationship
Ring radius is a clue to mass With the distances fixed, four times the mass makes twice the ring radius.
Reference ring Your ring
radius² ∝ mass
∝ means “changes in proportion to.”
Mass multiplier
1× mass 4× mass 9× mass
Source and lens distances stay fixed.
We can run this rule backward: measure a real ring, then solve for mass.
05 / The evidence
The Horseshoe gives us real inputs We need its ring radius and the distances from Earth to each galaxy.
5.0″ radius Ruler on
Hubble crop · ESA/Hubble & NASA. Overlay illustrates the published scale. Lens light-stretch, z 0.444
Source light-stretch, z 2.379
Observed radius ≈ 5.0″
Try a different radius z is redshift: how much expansion stretched the light. ″ is an arcsecond, 1/3,600 of a degree. The observed radius is about 5″.
Restore the published radius Belokurov et al. 2007 We have the radius. Next, convert the two redshifts into distances.
06 / The distances
Redshift supplies the missing distances The redshifts from the previous slide become the three distances in our equation.
Source redshift
Dl : Earth to lens. Ds : Earth to source. Dls : lens to source. Mpc is a distance unit; we convert it to metres next.
Angular-diameter distances. Dls ≠ Ds − Dl . Diagram not to scale.
Now we have both ingredients: the measured radius and the distance factor.
07 / The formula with real numbers
Put the radius and distances into the same equation We know the ring. Rearrange the rule to find the mass that must be inside it.
08 / The stars’ share
Now estimate the stars’ share Gravity weighed everything. The galaxy’s light gives a separate estimate for the stars.
The total mass from the previous slide
Gold: stars · outline: all the lensing mass
Independent models of the starlight put the stars at about 7% or 17% of the lensing total. Different mixtures of faint and bright stars give different masses.
We have a stellar mass. Use the square-root rule to predict its ring.
09 / The prediction
Would those stars make the ring we see? Use the stars’ share from the previous slide in the square-root rule we learned earlier.
Same stellar share as the previous slide Chabrier: 7% Salpeter: 17%
star ring / observed ring ≈ √(star mass / total mass)
Approximate mass-scaling comparison. A full stellar lens model also needs the radial distribution of the stars.
Spiniello et al. 2011 The stars’ predicted ring is too small. Next, account for the rest of the mass.
10 / The inference
The remaining mass is the missing part The stars-only ring fell short. Under general relativity, extra mass supplies the difference.
Add the missing part of the mass
Match the lensing mass Dark matter is the standard explanation after modeling ordinary matter. Lensing measures gravity; it does not identify a particle.
Before accepting extra mass, ask whether a modest radius error could close the gap.
11 / A useful challenge
Could a small measuring error erase the gap? Hold the stellar estimate fixed. Recalculate only the total mass as the radius changes.
Assumed radius
10% smaller Match the stars Starting radius
A sensitivity experiment, not the published uncertainty or a test of every systematic effect.
A small error changes the answer a little. It does not remove a several-fold mass gap.
12 / The takeaway
The chain of evidence Ring size gives total mass. Starlight gives a smaller stellar mass. The gap needs an explanation.
Check the rule: double the radius. How much mass?
2× 4× 8×
Choose an answer.
Restart the main story That is our result for the Horseshoe. Next: a different test of dark-matter models.
13 / Optional bonus
Do dark-matter models get every detail right? A new question, using galaxy clusters rather than the single Horseshoe galaxy.
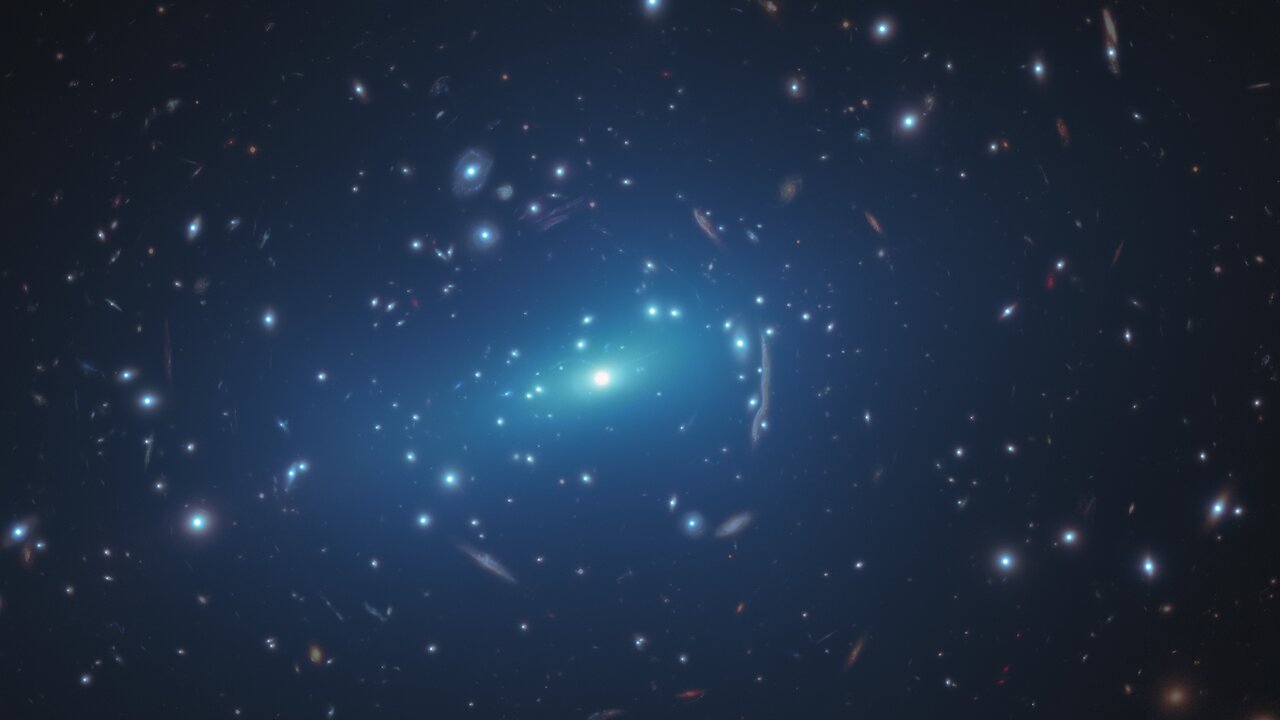
MACS J1206. Blue is an artist’s dark-matter overlay, not visible matter. NASA/ESA + CLASH team, Caminha, Meneghetti, Natarajan & Kornmesser Simulation 2020 observations
Lensing probability, normalized
1× reference
The 2020 study found >10× the predicted efficiency of small galaxy lenses inside 11 clusters.
This compares lensing probabilities, not our Horseshoe mass or a bend angle. A historical challenge to those simulations, not proof of modified gravity.
Meneghetti et al. 2020 We have tested the matter model. The final question is whether the gravity law could change instead.
14 / An alternative explanation
Could the gravity law change instead? Our mass inference assumed general relativity. Modified gravity questions that assumption.
Orbital speed (km/s) 0 200 400 5 50 Distance from galaxy center (kpc) Gold: Newtonian, visible mass only Blue: MOND, same visible mass
Illustrative spherical galaxy, 10¹¹ Suns. Curves are calculations, not observations of the Horseshoe.
MOND (Modified Newtonian Dynamics) changes the law at tiny accelerations. Compare two predictions for the same visible mass.
Distance from the galaxy center
Ordinary gravity: g = gN MOND choice: g² / (g + a₀) = gN
For our lensing story: predicting bent light requires a relativistic theory, such as TeVeS. MOND alone does not supply a new Horseshoe ring prediction. Galaxy clusters and cosmology remain difficult tests.
g: predicted pull. gN : Newtonian pull from visible matter.
Famaey & McGaugh 2012 · Bekenstein 2004
The goal is one explanation that works for galaxy motions, bent light, and the wider universe.
 Cosmic Horseshoe